What is a dashboarding tool or dashboard solution?
A dashboard is a visual display of key performance indicators (KPIs) and metrics that allows users to quickly and easily monitor and analyze the performance of their business, department, or campaign. In a marketing department, a dashboard typically shows data related to various marketing activities, such as website traffic, leads generated, social media engagement, email open rates, and conversion rates.
What are the benefits of dashboards?
Dashboards are important for a marketing department for several reasons:
1. Easy tracking of performance:
A dashboard provides a quick and easy way to monitor the performance of marketing activities and campaigns. It allows marketing professionals to quickly spot trends, identify issues, and make data-driven decisions to optimize their marketing efforts.
2. Clear communication:
Dashboards provide a clear and concise way to communicate marketing performance data to stakeholders such as senior management, sales teams, and clients. A well-designed dashboard can help stakeholders easily understand the data and make informed decisions.
3. Improved collaboration:
A dashboard can be used as a collaboration tool, allowing team members to view and analyze the same data in real-time. This can lead to improved communication and collaboration within the marketing department, which can result in more effective marketing strategies and campaigns.
4. Time savings:
Dashboards can save time for marketing professionals by automating the collection and presentation of data. This allows marketers to focus on analysis and decision-making, rather than spending time manually collecting and compiling data.
What are the pitfalls in implementing dashboards?
Implementing a dashboard in an organization can come with several pitfalls. Some of the common pitfalls include:
1. Lack of clear goals:
Without a clear understanding of the goals and objectives that the dashboard is meant to support, it can be difficult to design an effective dashboard. This can result in a dashboard that is difficult to use, irrelevant, or fails to provide meaningful insights.
2. Poor data quality:
Dashboards rely on accurate and reliable data to provide insights. If the data used in the dashboard is of poor quality or outdated, the insights provided by the dashboard will be inaccurate or misleading.
3. Poor design:
A poorly designed dashboard can be confusing and difficult to use, resulting in low user adoption rates and reduced effectiveness.
4. Lack of training:
Users may not understand how to use the dashboard effectively, which can lead to confusion and reduced usage.
5. Technical challenges:
Implementing a dashboard can require technical expertise, including database management, data integration, and dashboard development. Technical challenges can result in delays, cost overruns, or the inability to implement the dashboard at all.
6. Lack of stakeholder buy-in:
Without stakeholder buy-in, it can be difficult to get the necessary support and resources to implement the dashboard effectively. This can result in low user adoption rates and reduced effectiveness.
Organizations need experts to help navigate these potential pitfalls and ensure the successful implementation of a dashboard. Experts can help with designing the dashboard, integrating data sources, ensuring data quality, providing training, and resolving technical challenges. Experts can also provide guidance on best practices for dashboard design and implementation, ensuring that the dashboard meets the needs of the organization and provides meaningful insights. The expertise of professionals can help organizations avoid common pitfalls and achieve the full benefits of implementing a dashboard.
What is the best dashboard tool or app?
There are many dashboard solutions available in the market. Below is a guide to help you choose your preferred dashboarding tool.
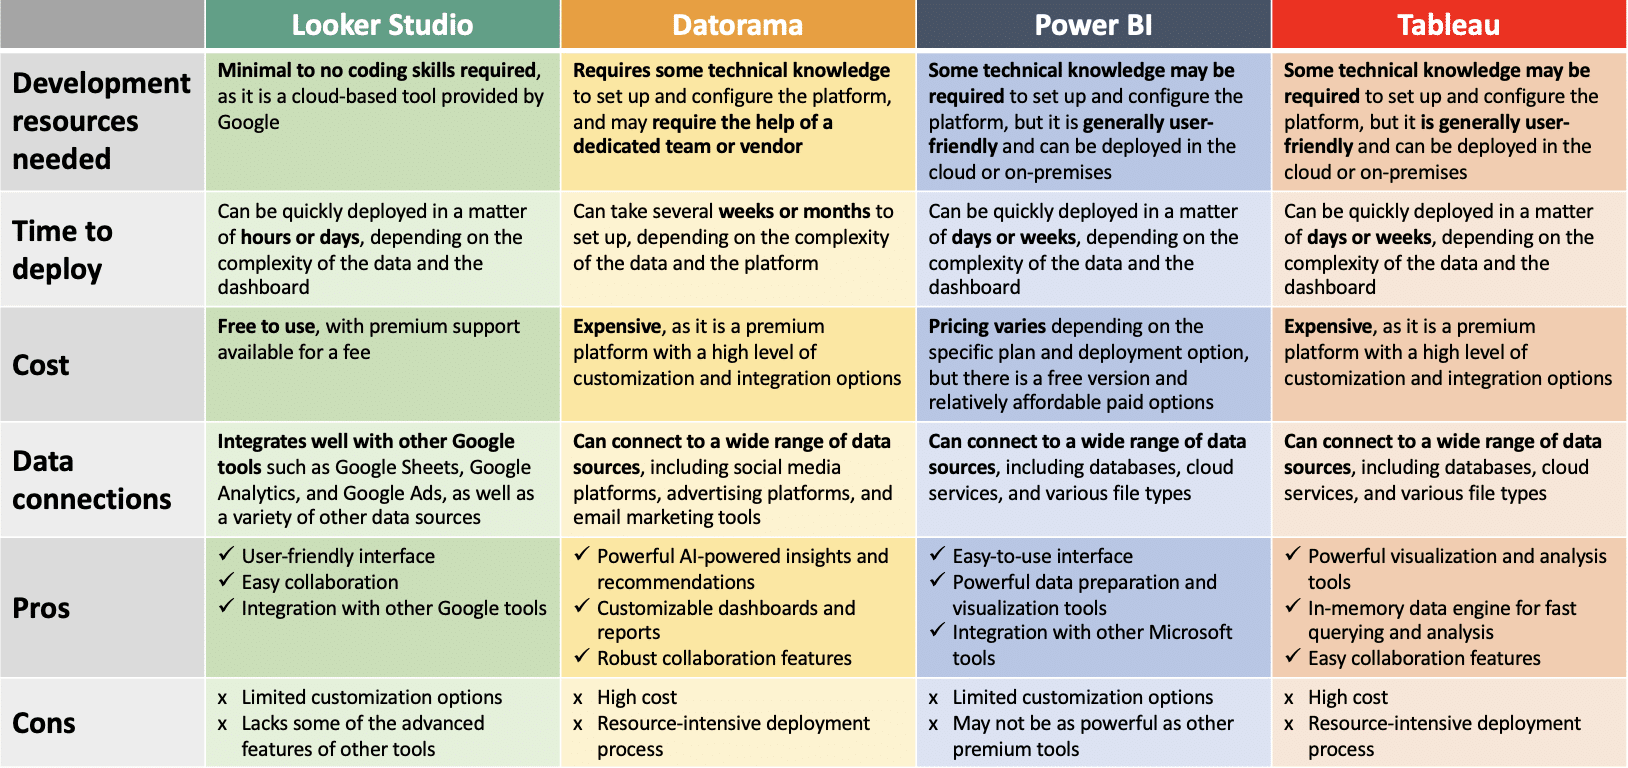
Each of these tools has its strengths and weaknesses, and the choice will depend on the specific needs and resources of the organization. Data Studio and Power BI are more affordable and user-friendly options, while Datorama and Tableau offer more advanced features and customization options but at a higher cost and resource-intensive deployment process.
Want to learn more about the dashboarding tool?
Contact us or follow us on Linkedin!
https://www.linkedin.com/company/indaru/
Featured Image by rawpixel.com on Freepik