Saturation Curves in MMM: understanding concepts like diminishing returns
As businesses seek to optimize their marketing efforts, it’s essential to understand the relationship between marketing spend and performance. One approach is to use saturation curves in marketing mix modeling to analyze the impact of different marketing mix variables on sales and other key performance indicators.
1.What are Saturation Curves?
Saturation curves are graphical representations of the relationship between input and output or response, where the output reaches a plateau or maximum level at high levels of input. In marketing, saturation curves are typically used to analyze the relationship between marketing spend and performance, such as sales or brand awareness.
Saturation curves can be used to identify the optimal level of marketing spend that will maximize return on investment (ROI). They can also help marketers to understand the point at which additional marketing spend is unlikely to result in significant incremental gains in performance.
2.Saturation Curves in Media Mix Modeling
Marketing mix modeling is a statistical approach used to determine the impact of different marketing mix variables on sales and other key performance indicators. Saturation curves are an important analysis done as part of a media mix model, helping to identify the optimal level of investment in each variable to achieve the desired outcomes.
In media mix modeling, saturation curves are used to analyze the impact of different channels, such as spend in TV, OOH, or digital, on sales. By analyzing saturation curves, marketers can identify the optimal level of investment in each variable to achieve the desired outcomes.
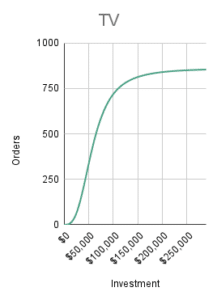
For example, consider the impact of TV advertising spend on sales. As TV advertising spend increases, sales are likely to increase, but at some point, the incremental gain in sales will diminish, and sales will plateau. Saturation curves can help to identify this point, enabling marketers to optimize their advertising spend by investing up to the point of diminishing returns.
Advertising Spend
The common uses of saturation curves in marketing mix modeling is to analyze the relationship between advertising spend and sales. Saturation curves can help to determine the point at which additional spending on advertising will no longer result in significant incremental gains in sales.
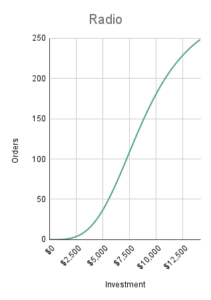
For example, suppose a company is analyzing the impact of their radio advertising spend on sales. They may start by investing a small amount in advertising and measuring the resulting increase in sales. As the company increases their advertising spend in radio, they can plot the resulting increase in sales on a graph to create a saturation curve.
As they continue to increase their radio spend, they may find that the incremental increase in sales begins to level off, and eventually reaches a plateau. This indicates that they have reached the point of diminishing returns, where additional spending on radio advertising is unlikely to result in significant incremental gains in sales.
By analyzing the saturation curve for radio advertising spend, the company can determine the optimal level of investment in radio that will maximize their return on investment. They can also identify the point at which further investment in radio would not result in significant gains in sales, allowing them to optimize their marketing budget and avoid overspending on radio.
3.How to calculate saturation curves
1.Hill Function:
The Hill function is commonly used to model sigmoidal saturation curves. It has parameters for the maximum value (`max_value`), the concentration at which the response is halfway between the minimum and maximum values (`half_point`), and the slope (`slope`) determining the steepness of the curve.
The pro of using this formula is that it allows for flexibility in adjusting the shape of the saturation curve by altering the Hill coefficient. This can be beneficial when the relationship between marketing variables and performance indicators is not precisely known. However, it may require a larger number of parameters to be estimated, making it more complex and potentially more computationally intensive than other formulas.
Lastly, this function is most suitable when there is a need to explore different shapes of the saturation curve and when a more complex relationship between marketing variables and performance indicators is suspected.
“`python
import numpy as np
def hill_function(x, max_value, half_point, slope):
return max_value * (x**slope) / (half_point**slope + x**slope)
“`
2.Exponential Saturation:
Exponential saturation curves can be modeled using an exponential function. The function takes an input (`x`), a maximum value (`max_value`), and a rate of saturation (`rate`).
An advantage of using this function is that it is relatively simple and computationally efficient. It assumes a constant rate of increase in performance with marketing spend until a saturation point is reached. Nevertheless, it assumes a fixed rate of saturation, which may not accurately capture real-world dynamics where the rate of saturation could vary.
This function is most appropriate when the rate of saturation is expected to remain relatively constant and when a simpler approach is preferred.
“`python
import numpy as np
def exponential_saturation(x, max_value, rate):
return max_value * (1 – np.exp(-rate * x))
“`
3.Logistic Function:
The logistic function is another commonly used function to model saturation curves. It has parameters for the maximum value (`max_value`), the rate of increase (`rate`), and the midpoint (`midpoint`).
A strong point of using this function is that it is a widely used formula that can accurately model saturation curves. It allows for the adjustment of parameters to control the shape of the curve, such as the steepness and midpoint. However, it can be more complex than the exponential saturation formula and may require additional parameter estimation.
The best circumstances to use the logistic function is when a smooth and well-defined saturation curve is expected, and when a moderate level of complexity in the analysis is acceptable.
“`python
import numpy as np
def logistic_function(x, max_value, rate, midpoint):
return max_value / (1 + np.exp(-rate * (x – midpoint)))
“`
These are just a few examples of functions that can be used to model saturation curves. The choice of function depends on the specific characteristics of your data and the nature of the saturation effect you are trying to capture. You can experiment with different functions and adjust the parameters to fit your data.
4.Do you want to optimize your media investment across channels?
One approach is to use saturation curves in your marketing mix models to analyze the impact of different marketing mix variables on sales and other KPIs.
Contact us or follow us on Linkedin!
https://www.linkedin.com/company/indaru/
Image by a href on Freepik