Usage of geo experiments to measure marketing effectiveness
In this article, you will learn about how to set an incrementality testing experiment that uses geolocation data instead of cookies. Geo experiments allow companies to measure the impact and effectiveness of their marketing initiatives in the real-world. By comparing outcomes between different geographical areas, companies can identify the causal impact of specific interventions, such as new pricing strategies, promotional activities, or changes to their product lineup.
This approach is not impacted by cookie restrictions, such as Intelligent Tracking Protection (ITP), and does not necessitate the use of personally identifiable information (PII).
1. What are geo experiments?
Geo experiments enable measurement of incremental outcomes by comparing predefined geographic areas that have similar size, sales trend and reaction to marketing campaigns to assess any improvements in performance metrics that are directly influenced by ad spend. When conducting geo experiments without the use of cookies, distinct geographic regions are precisely assigned to either an Experiment or Control group.
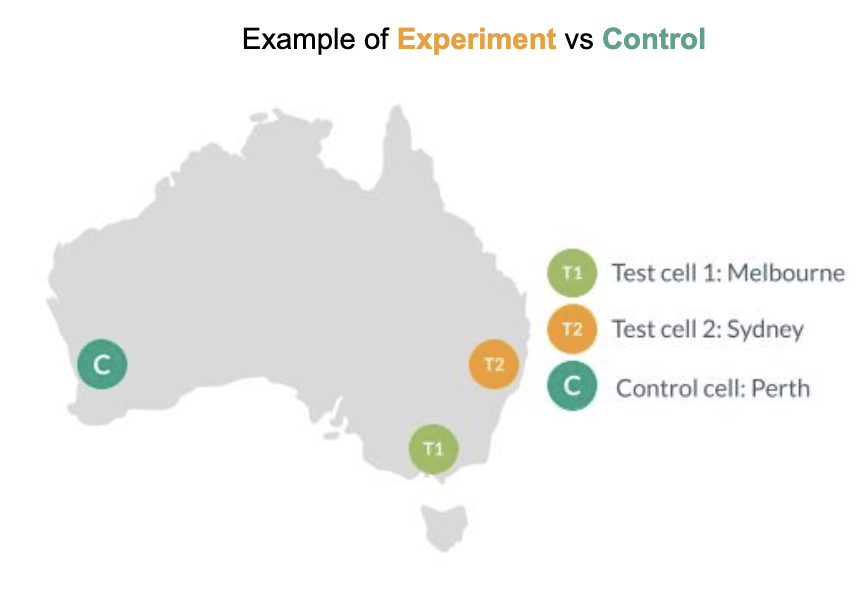
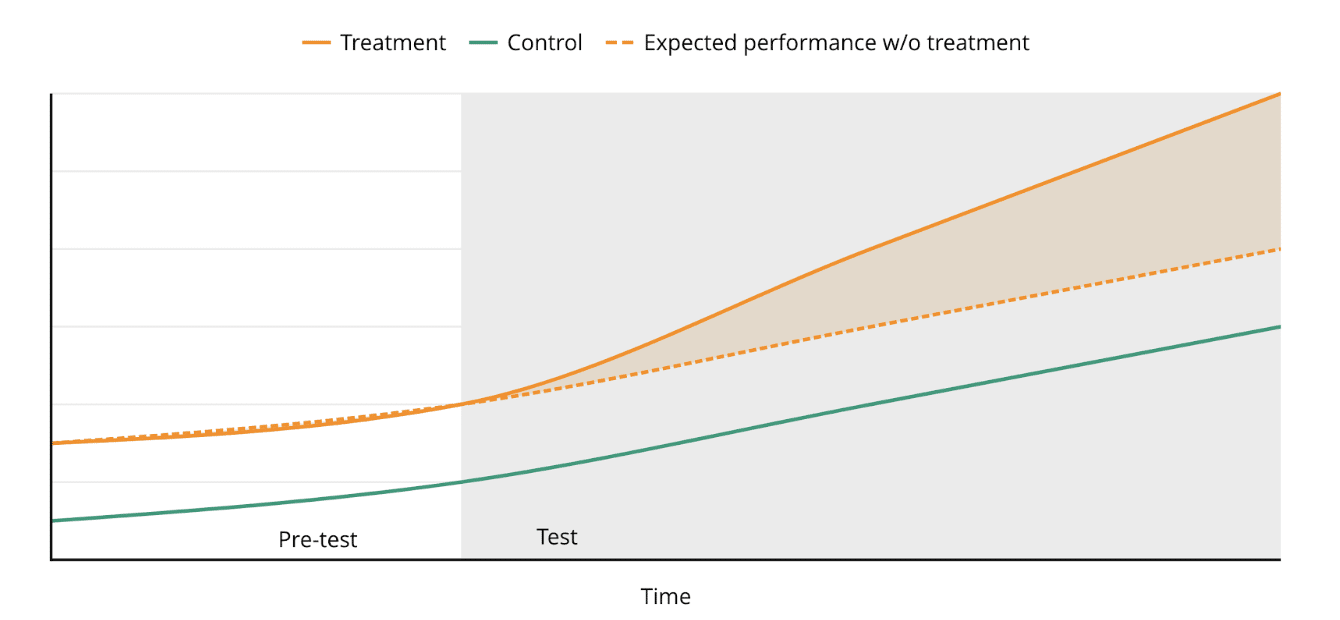
Before running the experiment you need to understand a baseline of overall performance across all geographic areas. Then, apply the test, such as increased ad spend, solely to the geos assigned to the experimental group. The outcomes of both the experiment and control groups should then be observed. Analyzing the control group enables estimation of the expected performance for the experiment group if they had not received the test intervention. This allows for the measurement of the “causal impact.”
2. Benefits of cookie-less geo experiments
Privacy-centric
Cookieless geo experiments do not depend on tracking users at the individual level. Instead, the data for such experiments is aggregated by geographical location, which is referred to as geo-aggregated data. This approach is not influenced by cookie restrictions like ITP and, at the same time, respects the privacy of users, making it a future-proof solution.
Device and technology agnostic
By leveraging geo-aggregated data rather than user-level data, this solution becomes device and technology agnostic. All that is required are the media and performance data aggregated by geography and day. As a result, offline data can also be incorporated into the analysis.
Robust methodology
Research white papers, support the geo experiment methodology, providing the ability to review and evaluate numerous studies.
3. What do you need to run geo experiments?
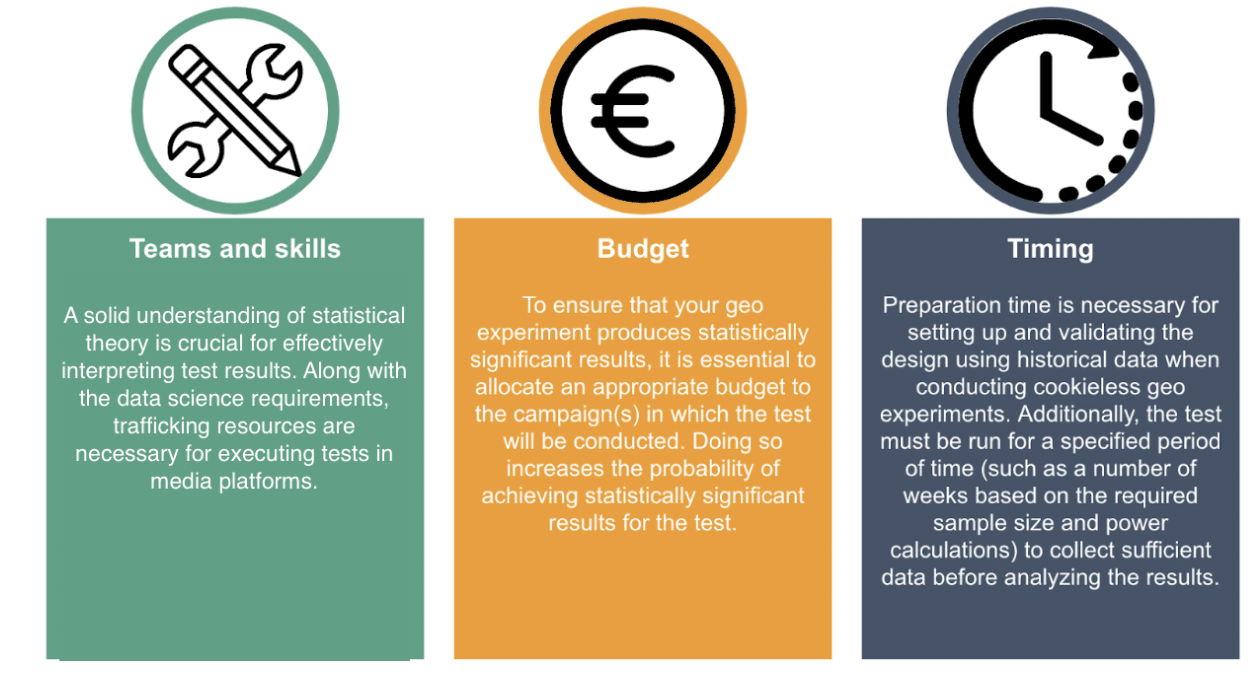
When transitioning to cookieless geo experiments to measure marketing efficiency, certain implementation steps must be taken. Proper planning and budgeting will be required, as well as the availability of the necessary resources and personnel. The following is a breakdown of the key considerations:
4. Setting up your geo experiment
Below is a sample project timeline for a geo experiment. Please note that the timeline provided is for illustrative purposes only, and the actual timeline may vary depending on the testing objectives.
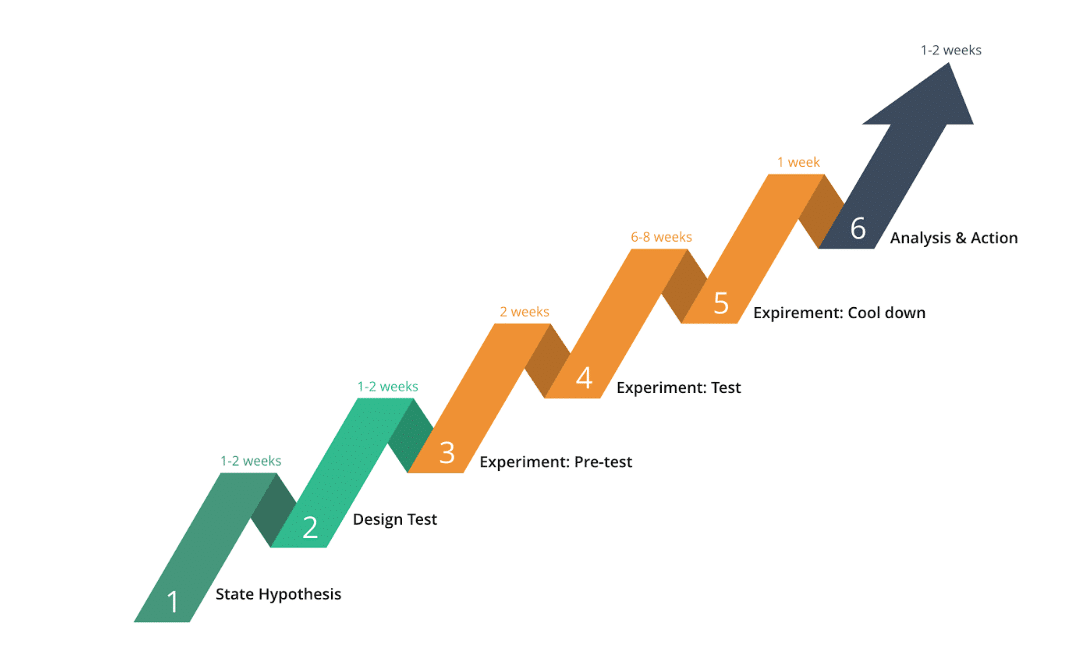
State Hypothesis
Begin by defining your hypothesis and selecting the key performance metric for analysis based on your marketing objectives. Determine the action to be taken on your campaign optimization as a result of your test analysis.
Design Test
Choose the appropriate media strategy and methodology to test your hypothesis. Assign geo locations to experiment and control groups in this stage by finding comparable cities via proper data science analysis. Validate the design to determine test feasibility in relation to statistical criteria based on potential budget and length.
Conduct Experiment
This stage is divided into three phases: pre-test, test, and cool-down. During the pre-test phase, experiment and control groups run under identical conditions to establish a baseline for the performance metric being evaluated. In the test phase, only the experiment group is subjected to the intervention condition to initiate incrementality measurement. The data collected during the test and cool-down phase is compared to the baseline. At the end of the test phase, allow for a cool-down period as some responses (e.g conversions) might be collected after the test.
Analyze & Act
Analyze the test results and take action on media campaigns accordingly. Use the test insights to develop new hypotheses and inform your next experiment.
5. Determining a hypothesis with the Right KPI and Post-Test Actions
To start, select the Key Performance Indicators (KPIs) and response metrics that are essential to your business and will impact your media decisions.
After defining the key performance indicators and optimization response metrics, plan the post-test actions that will be taken based on the test results. For instance, if ACME Motor Group achieves a 20% lift in test drive bookings through a video campaign geo experiment, they may consider increasing their video campaign budget.
It is advisable to document the hypothesis and actions in writing so that they can be referred to during the analysis phase.
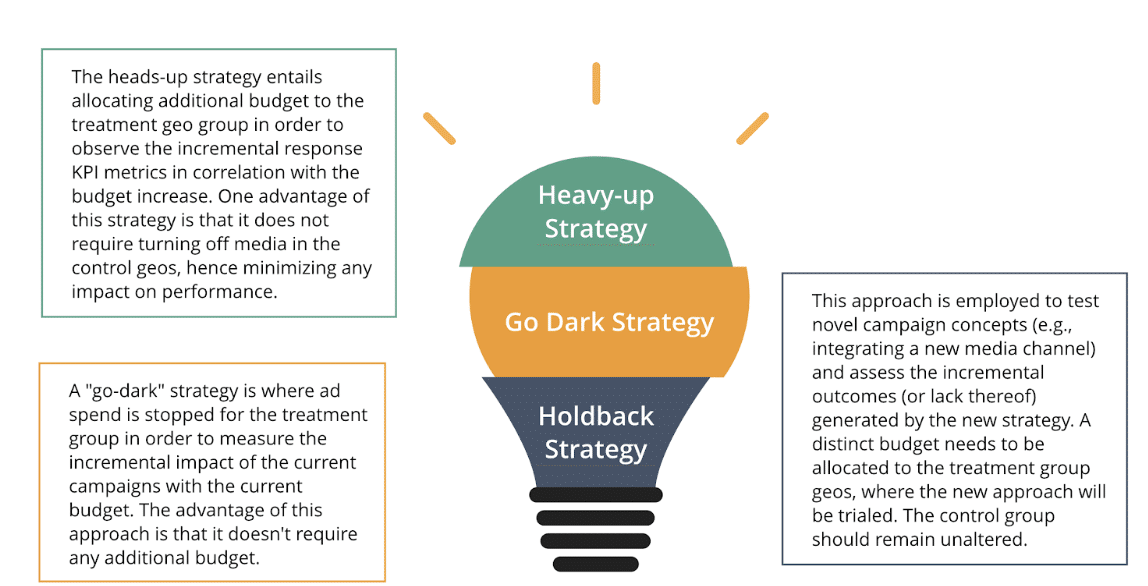
6. Geo experiment strategies
The subsequent task is to identify an appropriate geo experiment strategy. An outline of the three strategies is provided below, and each strategy will be explained in greater detail in the following pages of this guide.
Do you have more questions about running marketing experiments?
There are a lot of things to consider when running marketing experiments. If you want to learn more about geo experiments to measure the impact of your marketing campaigns, contact us or follow us on LinkedIn!
Image by natanaelginting on Freepik